
Abstract
This article offers a country comparison of the coronavirus pandemic data evidence available in order to identify which country or government actions have proved more successful in limiting the virus diffusion and mortality.
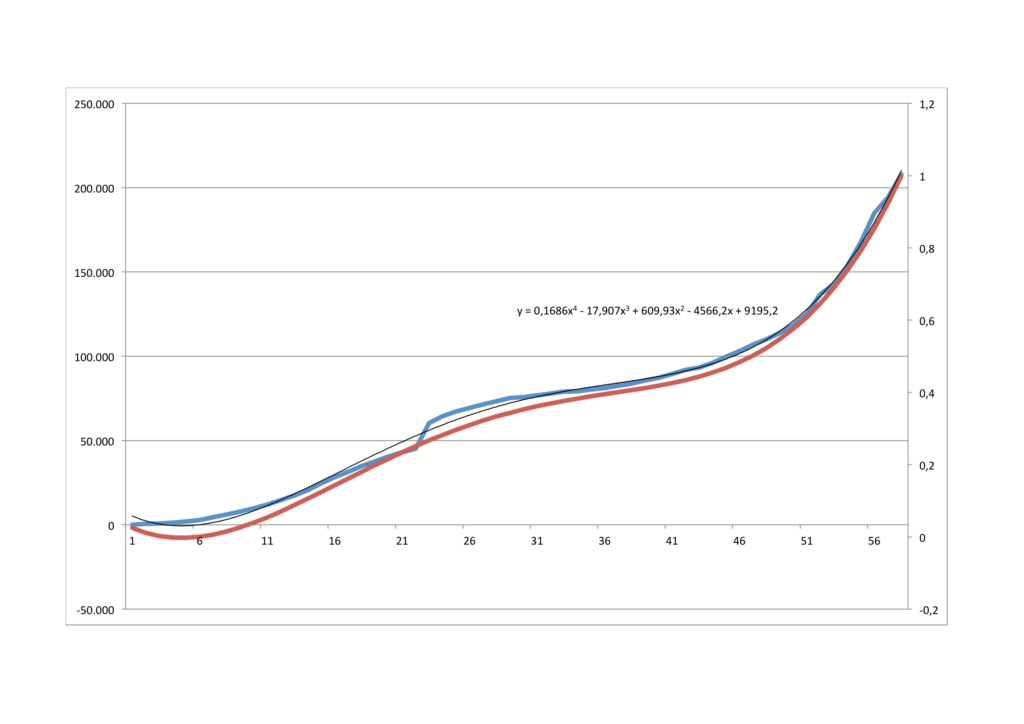
All numbers contained in the analyses come from public sources (Wikipedia, Worldometer.info, WHO). The diffusion curve pictured above is the product of a simple numeric model based on virus diffusion world data. Event timelines and press articles enabled to infer government actions dates. When the same government adopted multiple policies the different times, the date of policy with most profound social impacts were selected (e.g. containment vs travel ban). All data updated to march 18 2020.
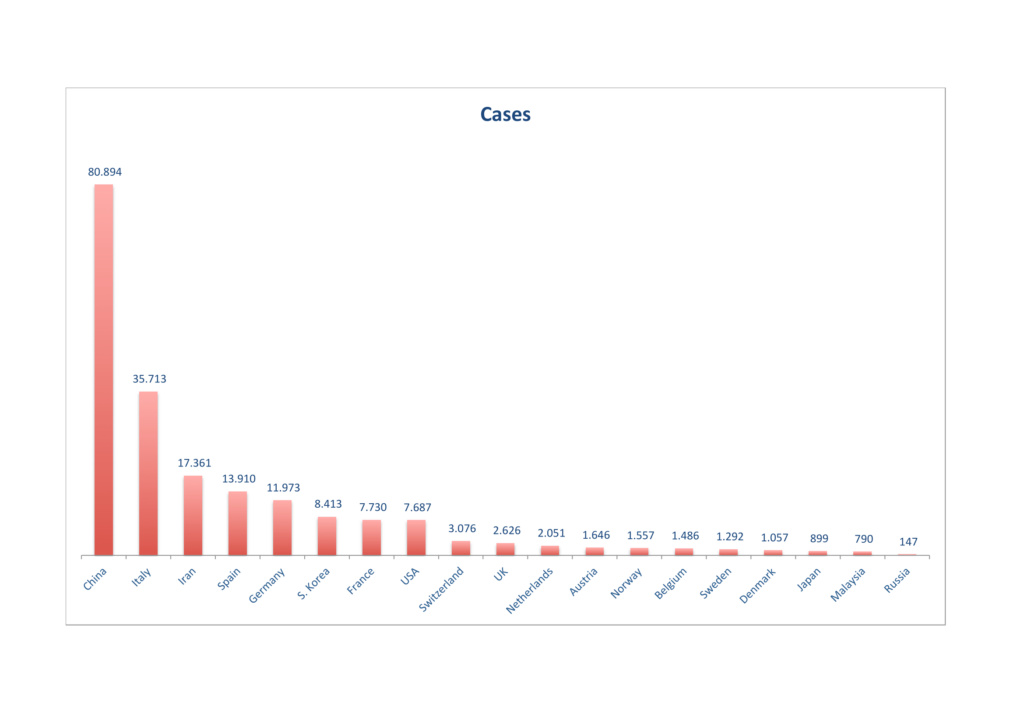
A country comparison of Coronavirus cases, as of March 18 2020 shows almost 200k confirmed cases in the 18 most affected countries. Russia, that has not shared official numbers, has been added with what available from public sources.
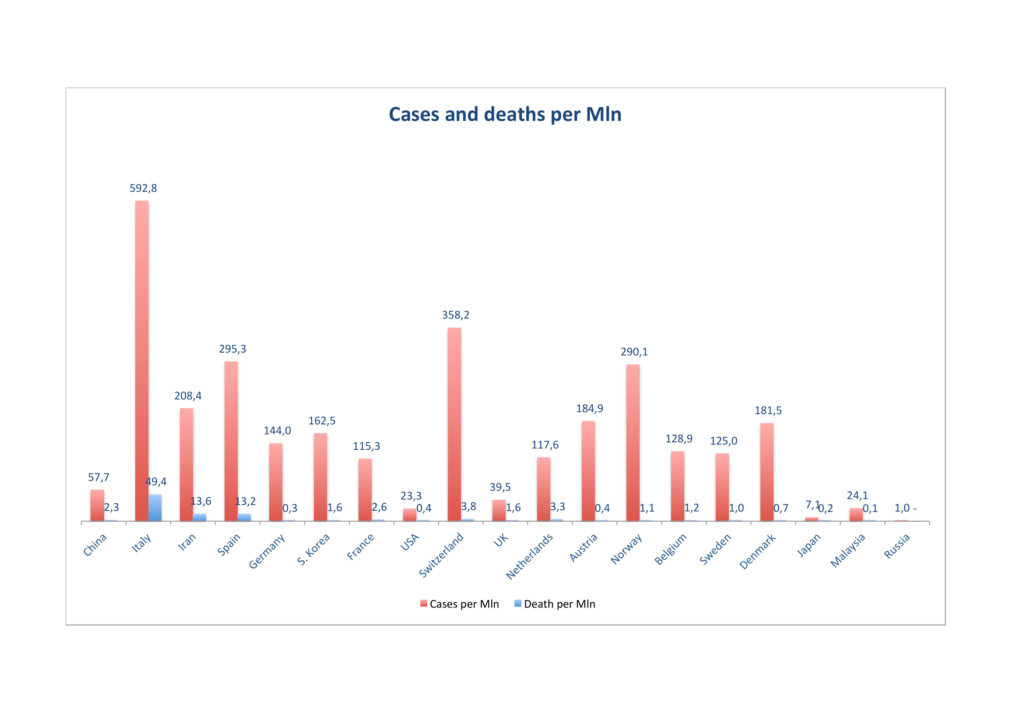
If we analyse cases per million population, it becomes pretty evident that the variations are wide. As the same dynamics for the spread of the virus are in effect in each country and countries, with the exception of the far east, have been effected pretty much at the same time, this can point only in three directions:
- countries are not reporting faithfully numbers
- countries are using very different reporting methods
- we are observing different strains of the virus, affecting at very different speeds
Distancing strategy
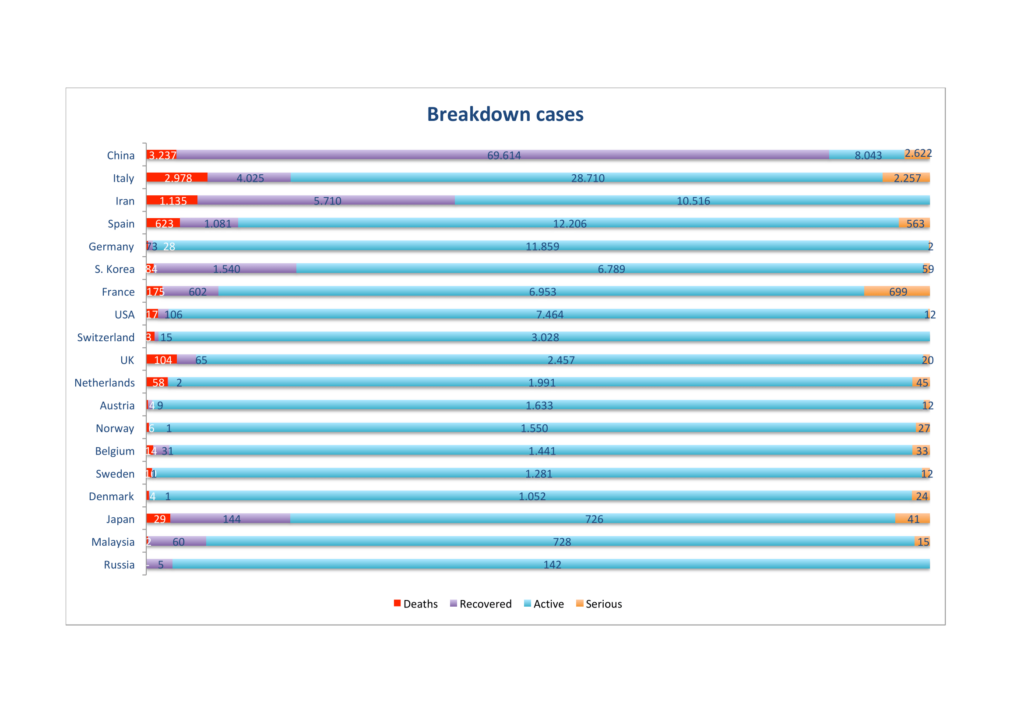
Breakdown of cases shows mostly that the virus has apparently started in the east and spread westwards, with the exception of Italy, the real anomaly. In fact we see recoveries highest in China, Iran, Japan, South Korea and Italy. Quite remarkably, death toll and severe cases show a high variation in relation to total cases. Deaths are proportionally particularly high in the UK, Spain and Japan. Countries like Italy, France and Iran have in proportion to active cases higher than average of severe cases.
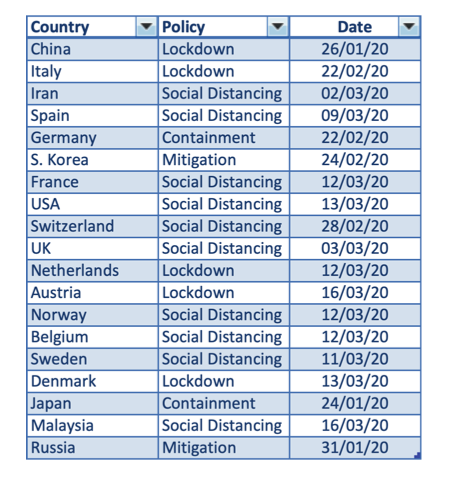
The above table shows a country comparison of the different policies chosen by different governments and the time they came into effect.
Testing
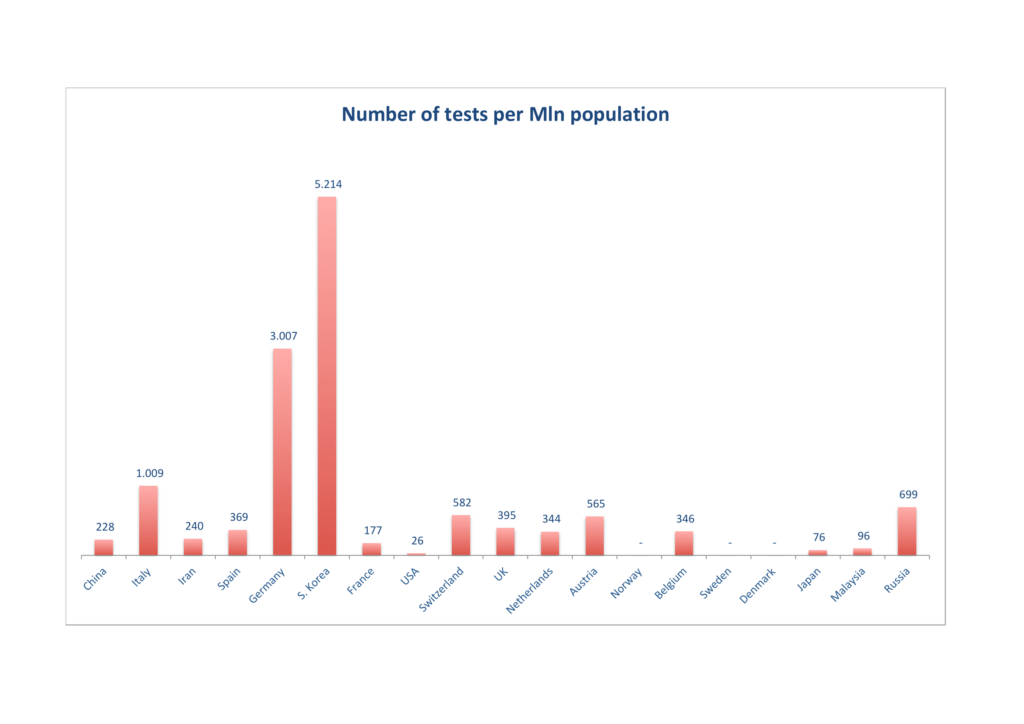
An item that can be a primary suspect for efficiency of containment is the number of tests carried out per mln population. In the above chart we observe that countries that have proved relatively successful at curbing the spread so far have performed a lot of tests on their population: S. Korea, Germany and Russia rate particularly high.
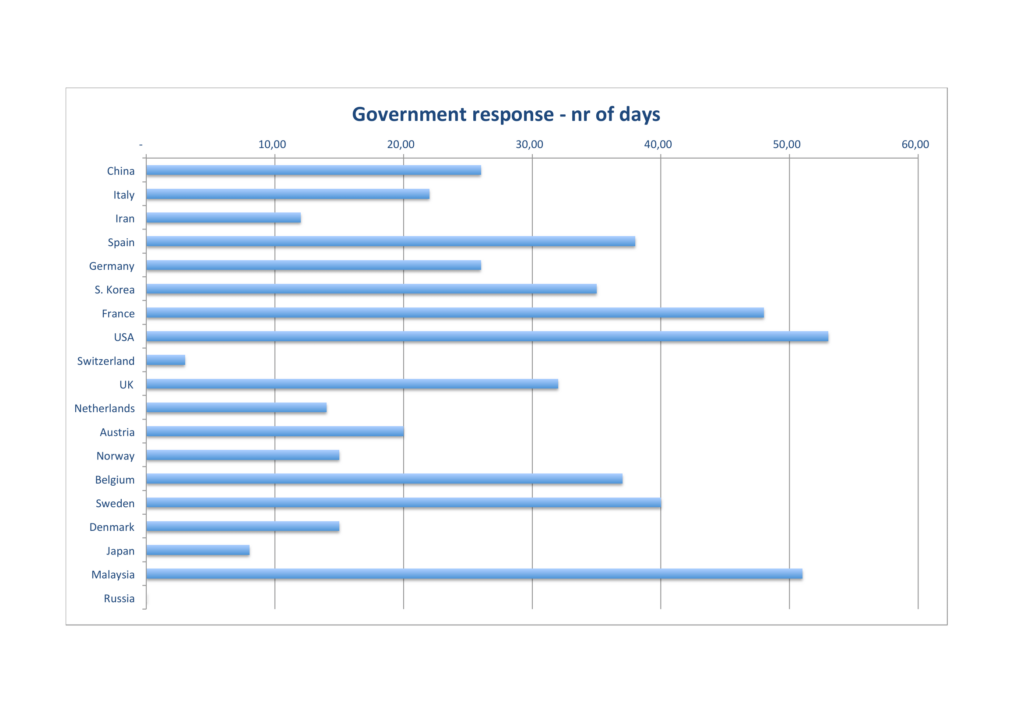
Government response
A country comparison of responses to coronavirus is also quite interesting to evaluate. The quickest one to act appears to be Switzerland, where probably early warning from neighbouring countries helped. In the above chart, Government action is counted as the number of days in between the detection of the first case and the issuing of the main protective policy.
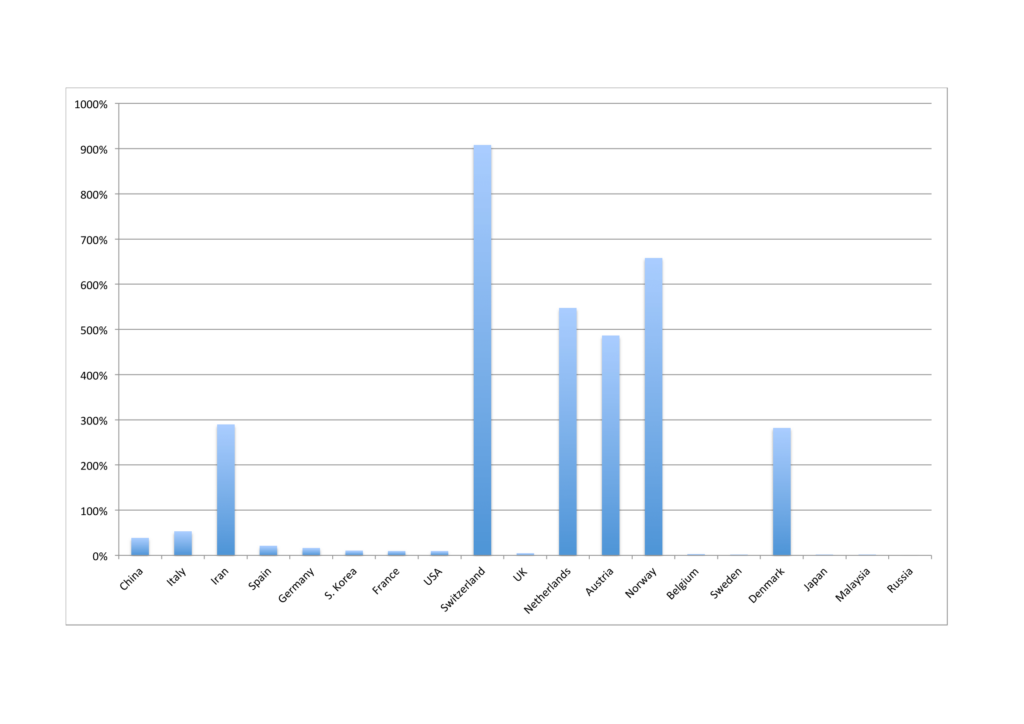
The effectiveness of government response is evaluated with respect to the 100% baseline: shorter implies better. The world model for virus diffusion offered the expected results for virus infections expected for each country. We then evaluated the ratio of actual cases to projected ones. You will observe a few higher than average results. Besides well known Iran, struggling to contain the virus, Switzerland, Austria and a few nordic countries seem to be in difficulty too. These countries are at a much earlier phase of virus diffusion (less days since the first case registered).
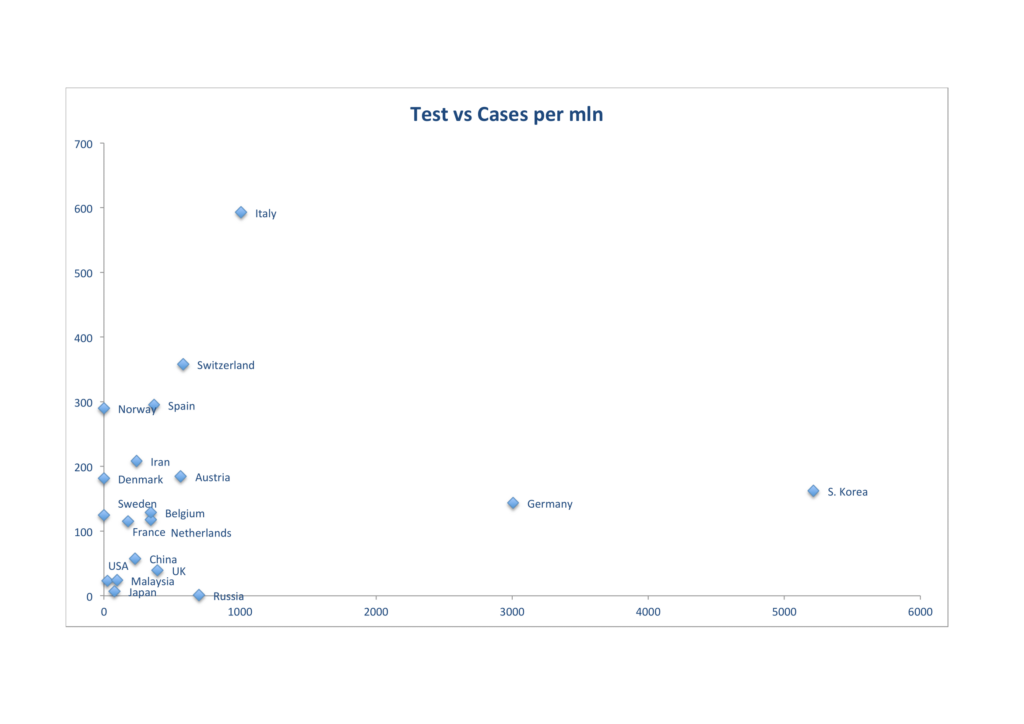
As an attempt to understand whether a policy is more effective than another, we added an evaluation of tests per mln population against cases per mln. As a result, there is some evidence in favour of large use of testing to favour virus containment. In addition, a connection between the high variation of cases in the countries that have done limited testing and the very early phase of the diffusion is plausible.
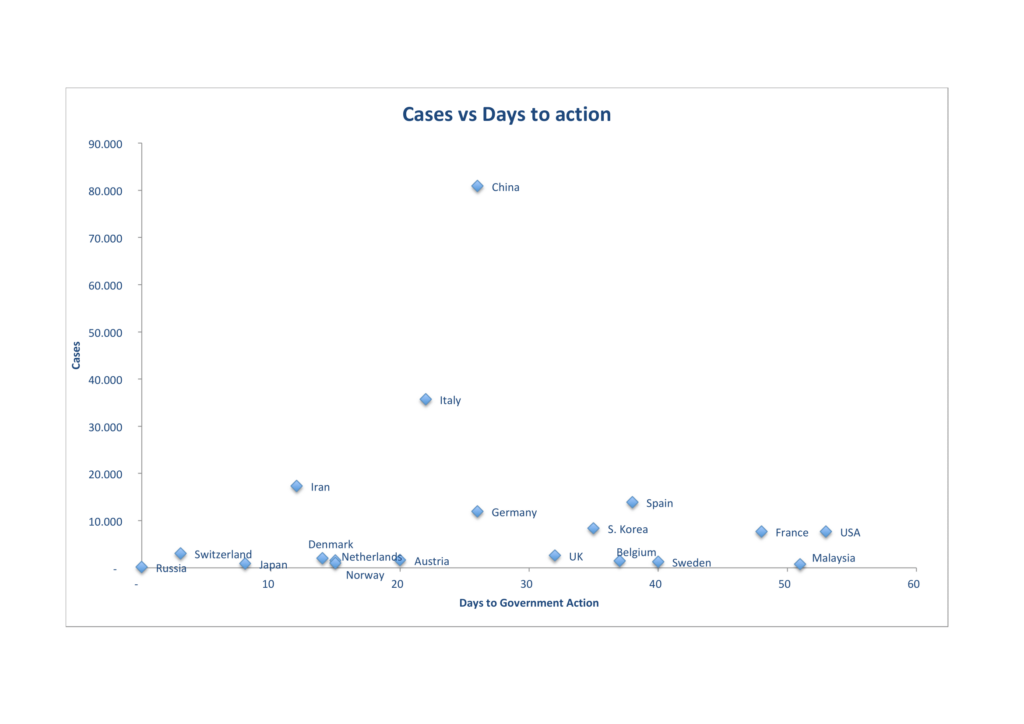
The above country comparison of government response to coronavirus elicits whether speed favoured virus containment. Again we observe mixed results, with several countries still in the early phase. In general there is evidence for a connection between the number of cases and a later adoption of a policy.
Well I think that for today we have gone through enough charts. I’ll see if I can update the analyses tomorrow with fresh data and finish of the article with the conclusions.
For more articles please check the blog.